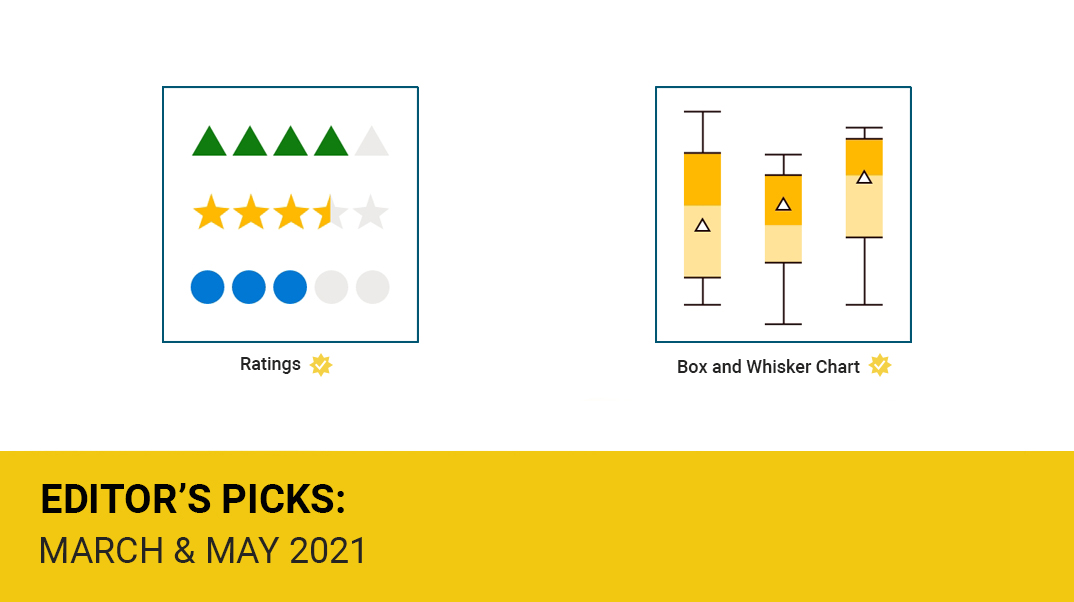
In May 2021, the Power BI team selected Box and Whisker Chart by MAQ Software for May's Editor’s picks. Box and Whisker Chart enables business leaders to quickly compare data distribution across multiple data sets, such as sales numbers across quarters and geographies. Users can tailor the visual to display personalized insights with options such as customizable dot sizes, hierarchical axes, and the ability to color-code data points. One of MAQ Software’s most popular Power BI custom visuals, Box and Whisker Chart has been downloaded over 116,000 times on AppSource.
In March 2021, two months earlier, MAQ Software had been honored by the Power BI team in their Power BI March 2021 Feature Summary. The team selected Ratings by MAQ Software among the monthly Editor’s Picks. A simple visual to use and analyze, Ratings offers the ability to add ratings or scores to Power BI reports. With Ratings, business leaders can view performance data and performance or approval scores from within the same Power BI report, enabling quicker decision-making. Ratings by MAQ Software has over 30,000 downloads and is rated 4.4 out of 5 stars on AppSource.
MAQ Software’s wide array of custom visuals enables business leaders to customize their data visualization experience. By simplifying the presentation of complex data, business leaders can quickly spot and act on valuable opportunities.
Download the free visuals from Microsoft AppSource now:
Ratings on AppSource
Box and Whisker Chart on AppSource
Download the free visuals from Microsoft AppSource now:
Ratings on AppSource
Box and Whisker Chart on AppSource